User Interface
The Gisquick clients are designed with a goal to put together minimal set of functions for useful generic responsive web and mobile friendly mapping application.
The major part of the clients User Interface (UI) is occupied by map
canvas (1). On the left side is located content management
tools (2) which is possible to hide by button on
its right side (3). Corners of map canvas are filled by (from
left-bottom corner, clockwise) by map scale (4), tools (5), user menu (6) and
zoom tools (7). In the bottom part is located
statusbar showing current scale, projection and map coordinates of the
cursor (8).

Figure 1: Gisquick user interface description.
Content management tools
Basic project metadata - project description - is accessible by question-mark, see figure below.

Figure 2: Project description.
Content management widget is split into three major tabs:
Base Layers
Overlay Layers
Legend
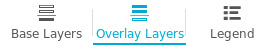
Figure 3: Content tabs.
Base Layers tab allows switching base layers in map canvas. The
list of base layers is defined by publication process as described in
Project publishing section.
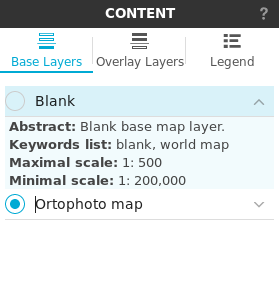
Figure 4: Switching between base layers.
Overlay Layers tab allows switching between topics (layer groups),
see Project publishing section, or
controlling overlay layers one by one.

Figure 5: Topics and layers switcher.
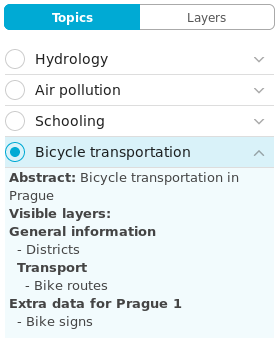
Figure 6: Switching between topics.
In Layers mode the overlay layers can be switch on/off one by one.
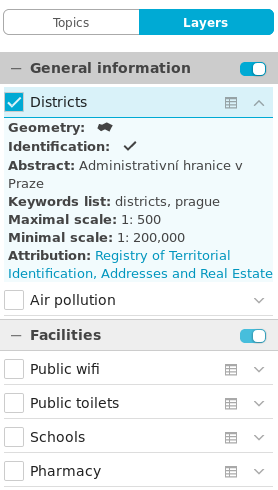
Figure 7: Switch on/off overlay layers.
Tip
 It is also possible to switch on/off group of layers
 .
.
Todo
Explain legend.
Attribute data
In Layers mode attribute data can be accessed by
 . Attribute table is displayed in bottom part, see
figure below.
. Attribute table is displayed in bottom part, see
figure below.

Figure 8: Layer attribute table.
Attribute table allows filtering data based on simple queries, see figures below.
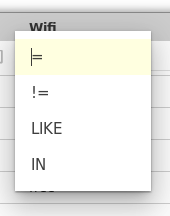
Figure 9: Choose operator for attribute filter.

Figure 10: Define filter and refresh attribute table view.
Tip
By default, attribute table shows only few rows. The
number of displayed rows can be controlled in status bar by Rows
by page. Attributes can be also filter by map canvas Filter to
visible area.
Every row in attribute table has Zoom to button  which
enables zooming and centering related features in map canvas, see
figure below.
which
enables zooming and centering related features in map canvas, see
figure below.

Figure 11: Zoom into selected feature.
Note
Attribute filter can be disabled by  . Table
view must be refreshed.
. Table
view must be refreshed.
Todo
Explain info panel.
Zoom tools
Zoom tools enables controlling map view.
Geolocation

Zoom in/out

Zoom to extent


Figure 12: Geolocation in action.
Tip
Zooming and panning is also possible by middle mouse button.
Tools
Two basic tools are available:
Identify
 , and
, andMeasurement

Identify
By default, features are identified in all visible layers (in the example below in Schools and District layers).

Figure 13: Identify schools and district layer.
This settings can be changed in Identification combo box.
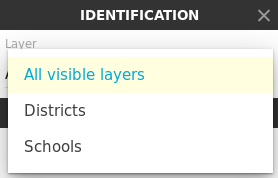
Figure 14: Change layer priority for identification.
Measurement
Three measurement modes are available:
Location (point coordinates)
Distance
Area
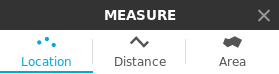
Figure 15: Measurement tools.

Figure 16: Location measurement example. Menu highlighted in red box.
Location menu allows:
Zoom to location
Change spatial reference system. By default two system are supported: QGIS project system and WGS-84 (EPSG:4326) known as “GPS coordinates”.
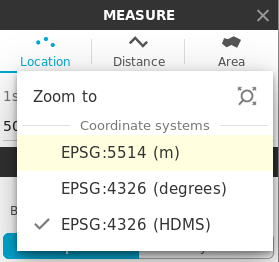
Figure 17: Location menu.

Figure 18: Distance measurement example. Menu highlighted in red box.
Distance menu allows:
Zoom to distance
Change units. Currently two systems are supported: international (EU) and imperial (UK, US)
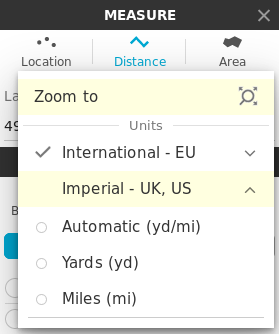
Figure 19: Distance menu.

Figure 20: Area measurement example. Menu highlighted in red box.
Area menu allows:
Zoom to distance
Change units. Currently two systems are supported: international (EU) and imperial (UK, US)
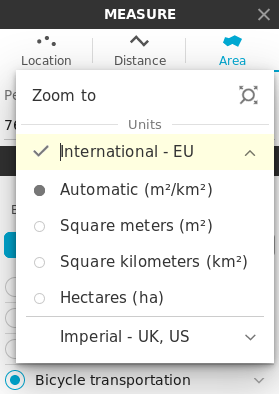
Figure 21: Area menu.
Note
Currently no snapping to features is supported by measurement tools.
Print tool
 The main idea is, that once print is activated in Gisquick, it
means that before project publication is
defined map composer in QGIS Desktop, it will download raw print
output from QGIS Server using GetPrint request and will allow
interactive visualization of map content directly in this template.
One can zoom, pan and rotate map and see exactly how the result will
look like. To get the better idea, see video below.
The main idea is, that once print is activated in Gisquick, it
means that before project publication is
defined map composer in QGIS Desktop, it will download raw print
output from QGIS Server using GetPrint request and will allow
interactive visualization of map content directly in this template.
One can zoom, pan and rotate map and see exactly how the result will
look like. To get the better idea, see video below.
Important
 Print tool in Gisquick is not accessible in
Guest session, only log in users can use
this tool.
Print tool in Gisquick is not accessible in
Guest session, only log in users can use
this tool.
User menu
User menu allows to:
Log out current user
Open user profile page
Enter/Leave Full Screen mode
Display attributions
Show Help (this document)
Show Project About (see Project publishing section)

Figure 22: Map attributions displayed.
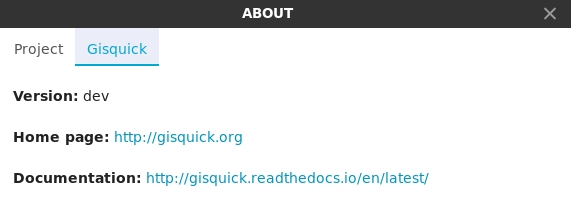
Figure 23: About window showing information about Project and Gisquick itself.
User profile page
User page ( in User menu) allows managing published projects, and uploading new projects.
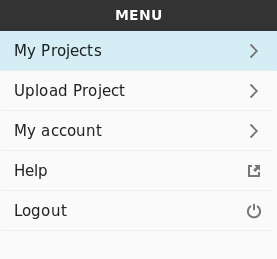
Figure 24: User profile menu.
In My Projects tab user can browse published projects including
basic metadata. Project can open by clicking on its name.
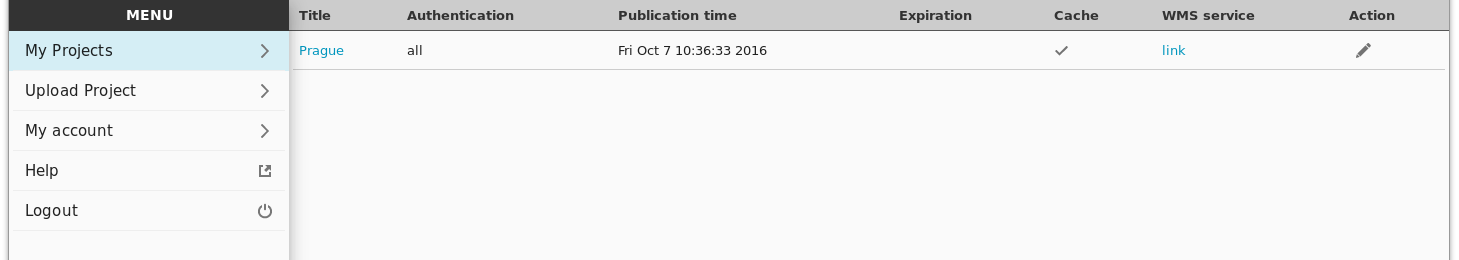
Figure 25: List of published projects.
Tip
Project data are available also via WMS service, see WMS
service link.
Action allows deleting project or updating table templates (see
Table templates section for details).
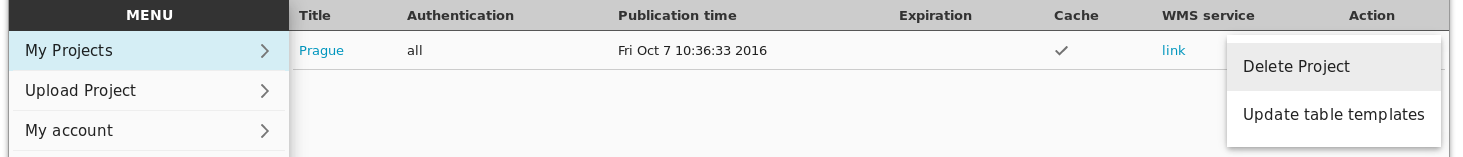
Figure 26: Project actions menu.
In Upload Project tab new projects can be uploaded. Note that
existing project will be automatically overriden. Projects can be
uploaded in zip or tag.gz formats.
Note
 See project size limits in Configuration section.
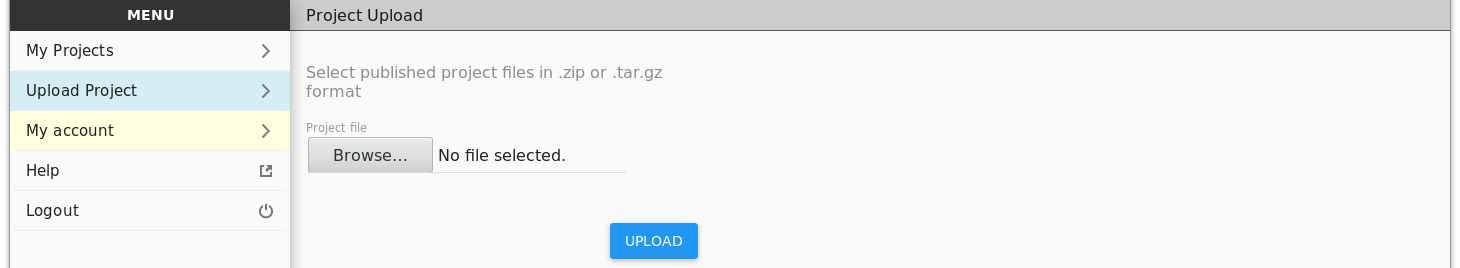
Figure 27: Upload project tab.
My account tab shows information about user account, see
User management section.
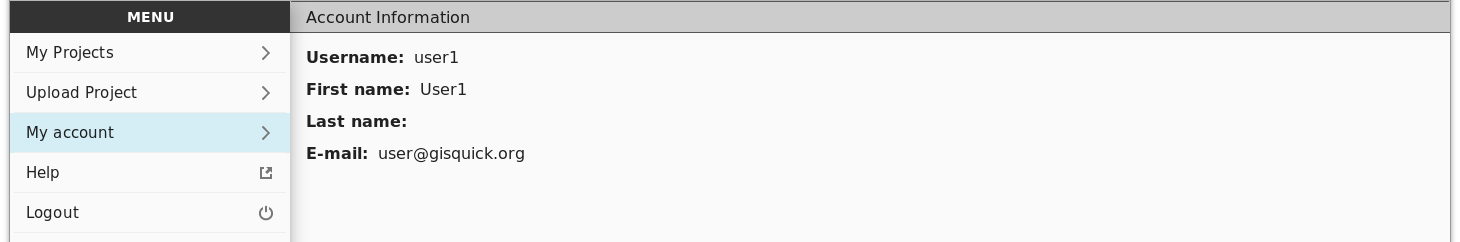
Figure 28: Account information.
Another two menu items allows showing help page (this documenation) and log out the user.